Three new World Gold Council reports on central bank activity, ETF flows and market conditions show who is buying, why momentum has held, and where the risks sit. Wall Street, for its part, is broadly onside.
Gold finished February at US$5,222 per ounce (oz) - up 5% for the month and 20% year-to-date.
The metal is trading around $5,079/oz as of today, holding in the low-$5,000s as markets continue to weigh the U.S.-Iran conflict, firm oil prices, and lingering tariff and recession concerns.
That puts gold still up more than 16% year-to-date and well within striking distance of its all-time high of $5,594/oz set on 29 January - a reasonable place to ask what is actually driving the structural bid beneath the daily noise.
On 2 February, J.P. Morgan raised its end-2026 gold price target to $6,300/oz - up from $5,055/oz - citing what it called an "ongoing, unexhausted trend of reserve diversification".
J.P. Morgan analysts noted this week that "conflict-driven surges in gold come and go, though geopolitical risks broadly are likely to stay on the boil" - a view that underpins their $6,300/oz forecast for end-2026.
Deutsche Bank reiterated its $6,000/oz target the same day J.P. Morgan revised higher.
Goldman Sachs sits at $5,400/oz by end-2026, expecting central banks to purchase around 60 tonnes per month through the year, with ETF holdings forecast to rise as the U.S. Federal Reserve moves to cut interest rates
The consistent risk flag across most institutional research is speculative positioning - derivatives markets are heavily long, and a macro shift could accelerate a short-term pullback even within a structurally bullish trend.
Central banks slower, broader
Central banks bought a net 5t in January, well below the monthly average of 27t across 2025.
The more instructive detail is in the composition, not the headline number.
Bank Negara Malaysia made its first net gold purchase since 2018, lifting reserves to 42t, while the Bank of Korea announced plans to incorporate overseas-listed physical gold ETFs into its reserves from Q1 2026 - its first gold-related investment since 2013.
Two central banks with long absences from the market, returning in the same month, is not a coincidence.
Uzbekistan was January's largest buyer at 9t, lifting its gold reserves to 399t - representing 86% of total reserves, up from 57% in 2020.
And Russia was the largest seller at 9t, though its circumstances are rather specific.
J.P. Morgan forecasts central bank purchases of around 755t in 2026 - below the 1,000-tonne-plus peaks of the prior three years, but still well above pre-2022 averages of 400-500t annually.
The step-down in tonnage is partly mechanical - at prices above $5,000/oz, central banks need fewer tonnes to shift their gold allocation meaningfully.
ETFs: nine months and counting
Global physically backed gold ETFs recorded their ninth consecutive month of inflows in February, adding US$5.3 billion to push total holdings to a new all-time high of 4,171t and global assets under management to a record US$701 billion.
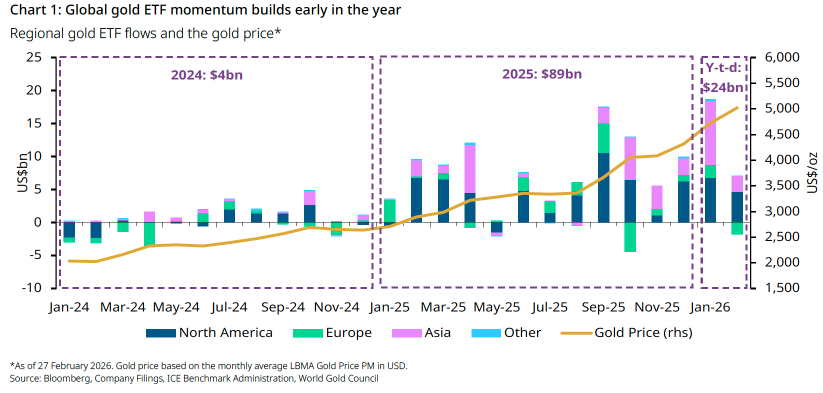
North America added US$4.7 billion - only the third time on record the region has logged nine straight months of inflows outside the initial ETF launch phase.
The other two instances were the Global Financial Crisis and COVID-19.
The drivers are by now familiar: Iran risk, dollar weakness, lower rates, Supreme Court tariff uncertainty, and equity market jitters as SaaS-related names weighed on broader indices.
Europe was the only region to record net outflows at US$1.8 billion, driven almost entirely by UK-listed fund redemptions in the first week following the late-January sell-off - not a structural regional shift, the WGC noted.
Asian funds extended their inflow streak to six consecutive months at US$2.3 billion, led by Japan, where a weakening yen and gold's 6% local currency gain supported demand.
The dollar is the story
The WGC's Gold Return Attribution Model points to a weaker U.S. dollar and softer Treasury yields as February's primary drivers.
Strong Asian buying during Asian trading hours cushioned an early-month dip that might otherwise have been deeper.
The WGC's base case is that the U.S. dollar's medium-term downtrend resumes after a near-term bounce.
U.S. valuations remain stretched on both a Real Effective Exchange Rate basis and price-to-sales relative to Europe and Japan.
Goldman Sachs co-head of global commodities Daan Struyven has made a similar case, describing the freezing of Russia's reserves in 2022 as the structural turning point that pushed central banks toward gold as the only unambiguously safe reserve asset.
What to watch
David Meger, director of metals trading at High Ridge Futures, said the market is "attempting to figure out whether these attacks are going to be followed up over the next several weeks," adding that "uncertainty is more than likely to support prices." CNBC
That uncertainty cuts both ways.
Historically, gold responds positively in roughly two-thirds of geopolitical tension spikes, but the subsequent two-week window shows a return range of +8% to -3%, with the hit rate falling to 57%.
High prices are also prompting profit-taking in European funds and cooling demand in India and China, where local currency strength ate into returns - local prices fell 3.5% in India and 1.3% in China despite gold's 4.8% U.S. dollar gain in February.
Total COMEX net longs fell 21% during February to 504t, though positioning data for the final week - when gold rallied on U.S.-Iran tensions - remained unavailable at time of publication.
The institutional consensus sits firmly bullish heading into Q2, but the gap between Goldman's $5,400/oz and J.P. Morgan's $6,300/oz signals real uncertainty about pace, if not direction.
This week's 5% intraday swing was a timely reminder that the ride to either target will not be smooth.