Western Australia has again claimed the top spot in CommSec’s latest State of the States report, extending its dominance in national economic performance rankings.
It marks the fourth consecutive quarter - and the fourth time since July 2014 - that Western Australia (WA) has ranked first, supported by strong gains in retail spending, housing finance, and equipment investment.

South Australia Climbs, Victoria Slips
South Australia made a notable jump, moving from fourth to second place with broad-based improvements in spending and investment.
Queensland held onto third, buoyed by low unemployment and strength in the housing finance sector.
Meanwhile, Victoria dropped from second to fourth, despite consistent mid-tier rankings across several indicators.
Tasmania held steady in fifth place, performing well in relative unemployment, while New South Wales slipped to sixth due to a slower-than-expected transition to private-sector-led growth.
The ACT joined NSW in equal sixth, despite leading on relative economic growth. The Northern Territory remained eighth, still feeling the aftershocks of its LNG construction boom earlier last decade.
Momentum Rankings: WA Still Leads
CommSec’s momentum rankings, which track annual growth rates across eight key indicators, also place Western Australia in first place.
The state’s robust private sector activity and strong population growth have driven consistent gains. South Australia moved into second following a brisk start to 2025.
The Northern Territory surged from fifth to third, while Queensland, NSW, and Victoria sat mid-table. The ACT and Tasmania rounded out the bottom of the rankings, limited by softer business investment.
ACT Leads in Economic Output Growth
Despite lower rankings in overall performance, the ACT posted the strongest economic output relative to long-term averages, rising 7.8% above its trend level in the March quarter.
South Australia followed closely at 7.4%, ahead of Victoria (6.4%) and the Northern Territory (5.8%). In contrast, Western Australia’s output was just 1.5% above its average.
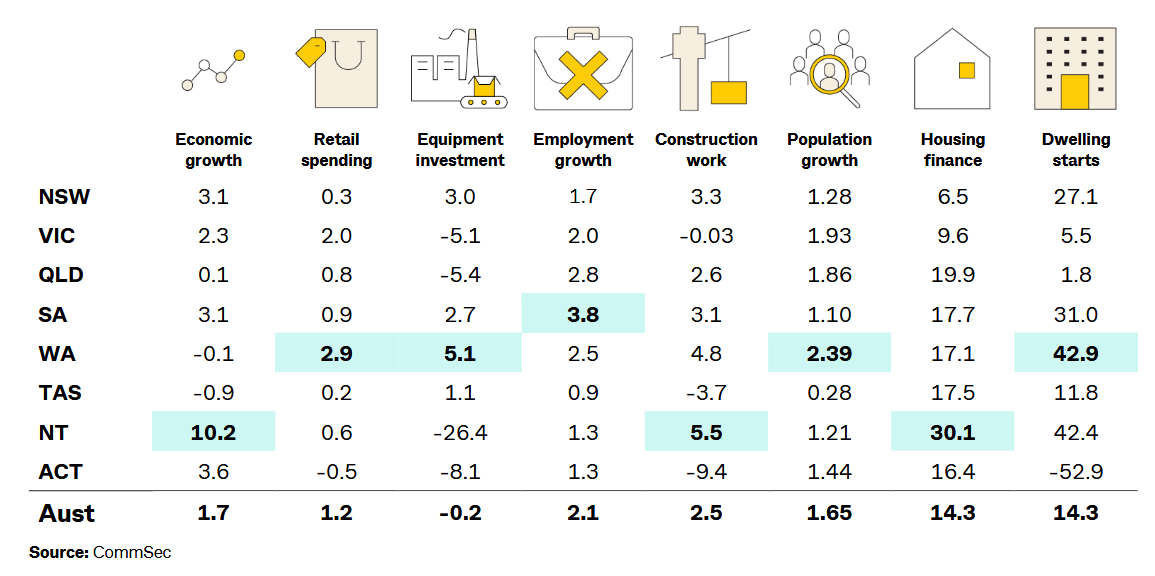
In terms of annual growth, the Northern Territory led all jurisdictions with a 10.2% year-on-year surge, followed by the ACT (3.6%), South Australia (3.1%), and NSW (3.09%). Tasmania recorded the steepest decline, contracting 0.9% year-on-year.
Retail Spending: WA Dominates Again
Western Australia maintained its lead in real retail trade, with spending up 11.5% on its decade average in Q1 2025. Victoria (10.0%) and Queensland (8.7%) followed. The ACT (7.9%) and South Australia (6.9%) rounded out the top five.
The weakest gains came from the Northern Territory (1.7%) and NSW (5.9%).
WA also led in annual retail spending growth (up 2.9%), ahead of Victoria (2.0%) and South Australia (0.9%). The ACT recorded the weakest result with a 0.5% annual decline.
Nominal retail data for May 2025 also reaffirmed WA’s top position, with 5.6% annual growth, followed by Queensland (4.1%) and Victoria (3.9%).
Construction Activity: SA Surges to the Top
South Australia now ranks first in construction activity, with completed work 16.7% above its decade average. Western Australia (14.6%) moved up to second, while Victoria (11.4%) fell to third.
The Northern Territory remained the weakest, with construction volumes 26.5% below average, and the ACT followed, down 7.2%.
Annual growth was strongest in the Northern Territory (up 5.5%), followed by Western Australia (4.8%) and NSW (3.3%). The ACT posted the sharpest decline, down 9.4%.
Inflation: Perth Records Highest Price Growth
Perth saw the highest annual inflation rate among capital cities at 2.8% in Q1 2025, slightly ahead of Brisbane (2.7%) and Melbourne and Sydney (both 2.3%). National CPI growth held steady at 2.4%, while underlying inflation eased to 2.9%.
Wage growth outpaced inflation across the country. The ACT led with a 3.9% annual rise in the Wage Price Index (WPI), followed by Western Australia (3.7%) and Queensland (3.6%).
Home Prices: SA Tops the Nation
South Australia saw the fastest growth in home prices over the year to June 2025, up 8.0%, followed by Western Australia and Queensland (both up 7.0%).
Only Victoria saw a decline, with prices down 0.4%. Nationally, home prices rose 3.4% over the year, down from 4.0% in the previous quarter.
QLD Public Sector Expands Under LNP
In a separate release, the size of Queensland’s public sector workforce has expanded significantly. As of March 2025, the state’s public service headcount reached 322,600, up from 308,033 a year earlier, according to the Queensland Government's ‘State of the Sector’ report, the first major workforce report since the LNP government assumed office in 2024.
Full-time equivalent (FTE) roles rose to 270,883, driven largely by hiring in the health sector.
When looking at the total headcount, about 64,500 workers were earning between $120,000 and $149,999 per year as of March - equating to about one in five employees.
This is up 38% from the 46,753 workers in this wage bracket at the same time last year, when they made up 15.2% of the public service.
Another 19,001 employees, or 5.89% of the total headcount, were earning between $150,000 and $179,999 as of March this year, reflecting a 66.7% increase from a year earlier, when there were 11,397 workers in this income category.