Are share prices more volatile than they used to be?
It depends on who you ask and how and when you measure it.
But factors like the emergence of mega funds, passive investing, day traders and algorithms are certainly changing the face of equities.
Immediate feedback
The issue was brought into sharp focus during the August profit-reporting season when the prices of a number of large stocks fell sharply on the day of their results.
Building materials group James Hardie (ASX: JHX) plunged by 28% after unveiling first-quarter numbers below expectations, while biotechnology giant CSL (ASX: CSL) and retailer Woolworths (ASX: WOW) shed 17% and 15% of their respective values.
The catalyst for CSL’s record one-day fall was lower than expected revenue from its plasma division, while Australia’s second biggest supermarket group dropped because its full-year numbers disappointed investors.
“Judging solely by share price volatility, we haven’t seen a reporting season like August 2025 in years,” Morningstar Equity Market Strategist Lochlan Halloway said.
He said the average change in the prices of the companies Morningstar covered was more than 6% on results days, with about a quarter of stocks swinging by more than 10%.
This is not just an Australian phenomenon, with some of the largest United States stocks bouncing around, an example being software giant Oracle, which surged almost 30% earlier this month after lifting the lid on extraordinary growth forecasts.
This helped founder Larry Ellison to overtake Elon Musk as the world’s richest person.
Halloway believed, however, that the rise of passive investing and the use of algorithmic programs to trade shares was probably introducing sharper price fluctuations.
“I don't have numbers to hand that suggest that 10 or 20 years ago things were less volatile, but you could see reasons why that might be the case,” Halloway said.
View from the Street
Morgans Financial Private Client adviser Lachlan Walsh said the reporting season was one of the more “brutal” seen for some time.
Of the 17 instances in the last 10 years when one of Australia's 50 largest companies fell by 10% or more on the day it reported, seven occurred in August 2025.
“We are still feeling the effects of those. It’s just such a reactionary market at the moment,” Walsh said.
A senior private client adviser said share prices fluctuated more than when he started in stockbroking in the mid-1980s, a time when a 5% movement was considered unusual.
“One of the elements that is accelerating it is technology. We’ve had algorithmic (algo) trading for a long time but it’s getting more aggressive,” he said.
“Another element is the increasing popularity of ETFs (exchange-traded funds). For these big portfolio investors the only way these things can be managed is by algo trading.”
These passive, index-tracking investment vehicles have grown strongly to claim about half of all funds under management since 2010 when their market share was negligible.
The advent of artificial intelligence (AI) allowed investors to use algorithms to scrutinise company announcements for key words to automatically drive buying or selling.
“We get it on both sides. It’s not just the negative, it’s also the positive,” the adviser said.
A stockbroker with more than 30 years of market experience said CSL had been hit by a “double whammy” of lower earnings and a reduced market earnings multiple.
He said that although the market believed the sell-off of the former market darling had been overdone, investors tended to react more when companies were fully priced.
James Hardie not only missed expectations, but the quality of the result was questioned at a time when confidence in the company had been dented by its merger with AZEK and the relocation of its primary listing from Australia to the United States.
“I think it’s fair to say that disappointments in this market are being dealt with more severely,” the broker said.
He attributed the rise in volatility to a number of factors, including the establishment of Australian trading desks by United States brokers, algo trading, and the emergence since the COVID-19 pandemic of ‘self-directed’ private investors.
The rise of the “U.S. merchants” had resulted in harsher market reactions to company results that failed to meet expectations for earnings per share.
“I don’t think it’s any one thing but rather a combination of these things means there’s a heightened reaction to what are perceived to be below expectation results,” he told Azzet.
“If it’s off by even a cent, the stock will get killed.”
Hard data
Anecdotal evidence that share prices did not always move around this much is supported by data and academic research over the last five to 10 years.
Wilson Asset Management produced the following graph to illustrate the increase in cross-factor volatility, which measures fluctuations in stock prices based on factors like investment styles (such as growth, value, momentum, cyclical and yield) and industry sectors.
The graph spans a period covering significant market events like the technology sector sell-off from 2000 to 2002, the global financial crisis in 2007 and 2008 and the COVID-19 pandemic from 2020 to 2021.
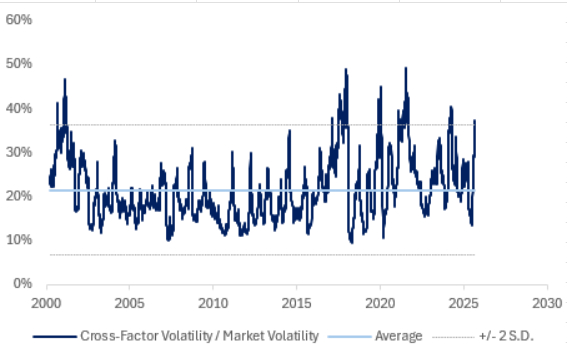
A market data analyst said cross factor volatility was unusually high at more than two historical standard deviations above the long-term average,
“What that is telling you is that individual stock volatility, controlling for what’s happening in the broader market, is actually very high and unusually so,” he told Azzet.
He attributed this to the increasing concentration of global investment in the hands of large investors like super funds, pension funds and sovereign wealth funds, which have a significant market impact with their decisions.
“If they are all positioning in a similar way or if they are all using a similar investments process what you will find is there’s a lot of crowding in particular names,” the analyst said.
Examples were growth companies like the so-called Magnificent Seven technology stocks (listed below), which had become “massively crowded” and overvalued from time to time.
Nvidia (NASDAQ: NVDA), Microsoft (NASDAQ: MSFT), Apple (NASDAQ: AAPL), Alphabet (NASDAQ: GOOGL) / (NASDAQ: GOOG), Amazon (NASDAQ: AMZN), Meta Platforms (NASDAQ: META) and Tesla (NASDAQ: TSLA).
Moving as one
“Without being derogatory, I call it three stooges syndrome,” he said.
“Everybody is in these stocks and while the marginal buyer is pushing up the price, everybody’s getting these unrealised capital gains, which is great.
“But the minute somebody decides to head for the exits, particularly one of these large institutions, everybody heads for the exit at the same time but they all get stuck in the door.”
This could produce extraordinary movement “underneath the bonnet of the equity market” at a time when the market is barely moving.
Anecdotal evidence that share prices did not always move around this much is backed up by academic research about idiosyncratic volatility (IV), which applies to individual companies independently of the overall market.
In fact, IV declined between 1926 and 1962 and between 1998 and 2017, according to Has Idiosyncratic Volatility Increased? Not in Recent Times, an Australian academic paper published in 2020.
The authors, Mardy Chiah of the University of Newcastle, Philip Gharghori of Monash University and Angel Zhong of Royal Melbourne Institute of Technology, replicated a study from 2001, which found that IV increased between 1962 and 1997.
But when they extended it to earlier and later periods, they reached the opposite conclusion.
Research firm Northfield noted in a presentation that financial markets had demonstrated low levels of volatility between the GFC and 2017.
The firm said the Chicago Board Options Exchange's CBOE Volatility Index (VIX) was 10.7 in November 2017, which was around the same level as just before the GFC in January 2007, and a fraction of the peak around 60 in October 2008.
“Realised volatility for the major stock indices around the world have been equally quiet for the past couple years and generally materially below long-term averages,” Northfield said in the presentation from 2017.
The VIX (CBOE: VIX), which measures the expected volatility of the S&P 500 index, was trading at 15.69 at the close of business on 15 September.
Nothing new here
Professor Peter Swan of the University of NSW Business School said share prices had always been volatile, with the extent of the movement varying over time and that the CSL and James Hardie prices collapsed because the market was unhappy with their results.
He said equities had carried a risk premium of 5% to 6%, one of the highest in the world, over the last 40 to 50 years and perhaps even longer, to compensate investors for the risk of price volatility.
“You might think with hindsight things weren't as exciting and colourful and volatile as they are now, but if you just relive your moments, you'd probably find many instances where individual stocks suffered greatly,” Swan said.